
Page 65 - Powerpoint-En-V3
P. 65
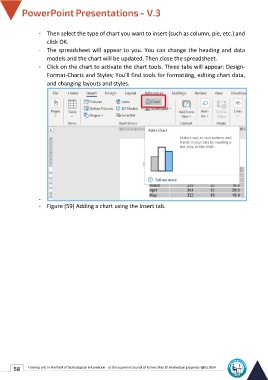
- Then select the type of chart you want to insert (such as column, pie, etc.) and
               click OK.

            - The spreadsheet will appear to you. You can change the heading and data
               models and the chart will be updated. Then close the spreadsheet.

            - Click on the chart to activate the chart tools. Three tabs will appear: Design-
               Format-Charts and Styles; You'll find tools for formatting, editing chart data,
               and changing layouts and styles.

            -
            - Figure (59) Adding a chart using the Insert tab.

58 Training unit in the field of technological information - at the Supreme Council of Universities © Intellectual property rights 2024