


Page 390 - CyberSecurityEssentialsEnglish
P. 390
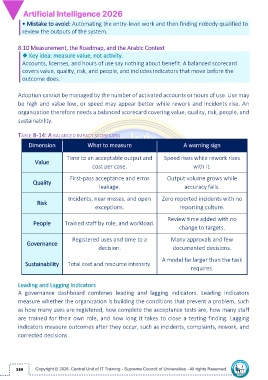
• Mistake to avoid: Automating the entry-level work and then finding nobody qualified to
           review the outputs of the system.

         8.10 Measurement, the Roadmap, and the Arabic Context

           ◆ Key idea: measure value, not activity.
           Accounts, licenses, and hours of use say nothing about benefit. A balanced scorecard
           covers value, quality, risk, and people, and includes indicators that move before the
           outcome does.


         Adoption cannot be managed by the number of activated accounts or hours of use. Use may
         be high and value low, or speed may appear better while rework and incidents rise. An
         organization therefore needs a balanced scorecard covering value, quality, risk, people, and

         sustainability.

         TABLE 8-14: A BALANCED IMPACT SCORECARD
              Dimension                 What to measure                            A warning sign


                               Time to an acceptable output and           Speed rises while rework rises
                 Value
                                          cost per case.                               with it.


                                First-pass acceptance and error            Output volume grows while
                Quality
                                             leakage.                              accuracy falls.

                               Incidents, near misses, and open          Zero reported incidents with no
                  Risk
                                           exceptions.                           reporting culture.

                                                                           Review time added with no
                People        Trained staff by role, and workload.
                                                                                 change to targets.


                                 Registered uses and time to a               Many approvals and few
             Governance
                                             decision.                        documented decisions.

                                                                         A model far larger than the task
            Sustainability     Total cost and resource intensity.
                                                                                      requires.

         Leading and Lagging Indicators
         A  governance  dashboard  combines  leading  and  lagging  indicators.  Leading  indicators

         measure whether the organization is building the conditions that prevent a problem, such
         as how many uses are registered, how complete the acceptance tests are, how many staff
         are trained for their own role, and how long it takes to close a testing finding. Lagging

         indicators measure outcomes after they occur, such as incidents, complaints, rework, and
         corrected decisions.


        389

