
Page 128 - Excle-En-V3
P. 128
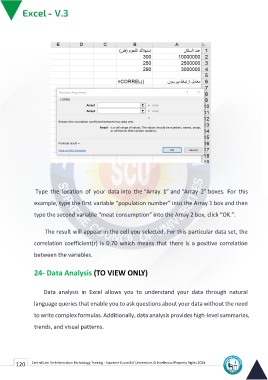
Type the location of your data into the “Array 1” and “Array 2” boxes. For this
        example, type the first variable “population number” into the Array 1 box and then
        type the second variable “meat consumption” into the Array 2 box, click “OK.”.

              The result will appear in the cell you selected. For this particular data set, the
        correlation coefficient(r) is 0.70 which means that there is a positive correlation
        between the variables.

      24- Data Analysis (TO VIEW ONLY)

             Data analysis in Excel allows you to understand your data through natural
        language queries that enable you to ask questions about your data without the need
        to write complex formulas. Additionally, data analysis provides high-level summaries,
        trends, and visual patterns.

120 Central Unit for Information Technology Training - Supreme Council of Universities © Intellectual Property Rights 2024