
Page 133 - Excle-En-V3
P. 133
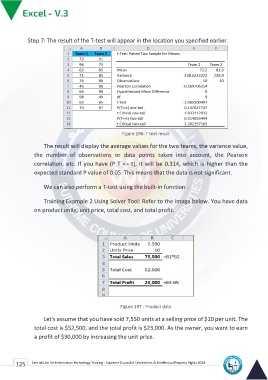
Step 7: The result of the T-test will appear in the location you specified earlier.

                                                                Figure 196: T test result

             The result will display the average values for the two teams, the variance value,
        the number of observations or data points taken into account, the Pearson
        correlation, etc. If you have (P T <= t), it will be 0.314, which is higher than the
        expected standard P value of 0.05. This means that the data is not significant.

             We can also perform a T-test using the built-in function .
             Training Example 2 Using Solver Tool: Refer to the image below. You have data
        on product units, unit price, total cost, and total profit.

                                                               Figure 197 : Product data

             Let's assume that you have sold 7,550 units at a selling price of $10 per unit. The
        total cost is $52,500, and the total profit is $23,000. As the owner, you want to earn
        a profit of $30,000 by increasing the unit price.
125 Central Unit for Information Technology Training - Supreme Council of Universities © Intellectual Property Rights 2024