
Page 92 - Excle-En-V3
P. 92
15 - A chart or graph:
The Excel program provides the conversion of numbers in a specific table into a
chart in order to facilitate reading data and quickly reach results. Charts help in
reaching various decisions quickly, and this feature is one of the most important
advantages.
The chart must contain a title that explains the content of the overall chart. This
Figure 132: Conditional formatting result title is usually
at the top of the chart. A title must also be given to the “x” axis and the coordinates
of the “y” axis, explaining its contents. It also contains illustrative forms called the
legend key through which the contents of the chart are explained. In order to obtain
an integrated diagram that is clear and easy to read by simply viewing it, the above-
mentioned elements must be available
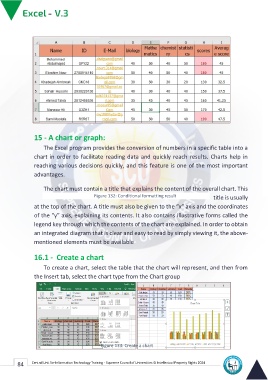
16.1 - Create a chart
To create a chart, select the table that the chart will represent, and then from
the Insert tab, select the chart type from the Chart group
Figure 133: Create a chart
84 Central Unit for Information Technology Training - Supreme Council of Universities © Intellectual Property Rights 2024